
The Wall Street Journal has produced a series of charts to explain the president’s 2013 budget. It shows the usual information we’ve come to expect from government reports, yet another year of deficits, most of it going to entitlements and little evidence indicating the budgetary situation is likely to improve anytime soon. However, even that simplistic view is hopelessly optimistic.
While most of them take some effort to decipher, one particular chart stood out, the Medicare Spending graph which appears to show a fairly steady increase over the next five years.
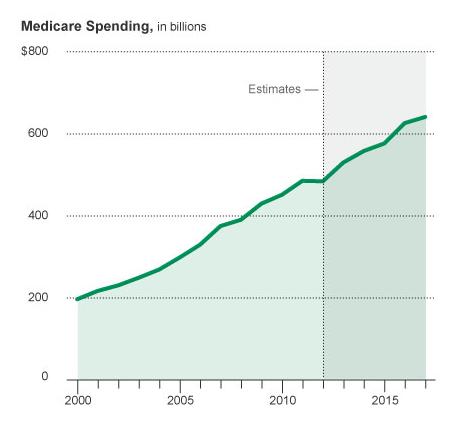
It looks bad, but not horrific. While the chart seems to be fairly linear in growth, but the problem is more significant when looked at in a larger context. Using government spending data going back to 1975, we can track the exact course of medicare spending. I’ve taken the WSJ chart and extended it to include previous years going back t0 1975. These numbers are in billions. Click to enlarge.

As you can see, the debt is not growing at the same rate. It took us 25 years to reach $200 billion in medicare spending, but only took the next 8 to double it. As we’ve explained in the past, this is not linear growth, but exponential growth.
The Congressional Budget Office predicts total federal spending on Medicare, Medicade and other programs will double to $1.8 trillion by 2022. This chart only involves Medicare, but lets extend the chart to see its full effect assuming that growth continues at the same rate as it has in previous decades (about 9.1 percent). Before you ask, yes, the CBO projects something very similar for all medical costs. Again, click the image to enlarge.

This is an exponential growth curve. You can see that a Google image search of exponential growth curve reveals similar results. It grows faster as time goes on. So while the situation looks like a minor problem over a short period of time, examined in total, it’s clear there is no way our spending is sustainable. While no one can predict when or how a financial crisis will materialize, the likelihood of such an event occurring is increasing rapidly.
For more on exponential growth, read my latest article, “End Game of the United States as We Know It” for more on how this will affect the country in the coming years.
Also, examine this video for an explanation of exponential growth.
